
Utilizing predictions from ML
At this point, everything is ready. Now, to be able to perform predictions about Covid-19 from an X-ray image, we need to load our pretrained model (available in this chapter’s GitHub repository; the link can be found in the Technical requirements section) and use it with the uploaded picture (pre-processed according to the code we wrote in the Creating customized web apps to improve user experience section). As explained in the Understanding the benefits of pretrained ML models section, using a pretrained model is an easy and fast way to solve a problem without spending time developing an AI model by ourselves. In our specific case, we can predict the presence of Covid-19 from an image just by loading and using a model developed and made available by others.
Let’s start writing:
model = tf.keras.models.load_model(“./models/Covid19_CNN_Classifier.h5”)
In the preceding code, tf is the alias of tensorflow, and keras is a module inside it. So, we just pass to the load_model method the path to our pretrained model (please note that the file type of tensorflow models is h5) and save it into a variable named model. Please note that the pretrained CNN was put in a directory named models, so if you changed its position, please update the path in the code accordingly.
This is the code we’ve implemented so far:
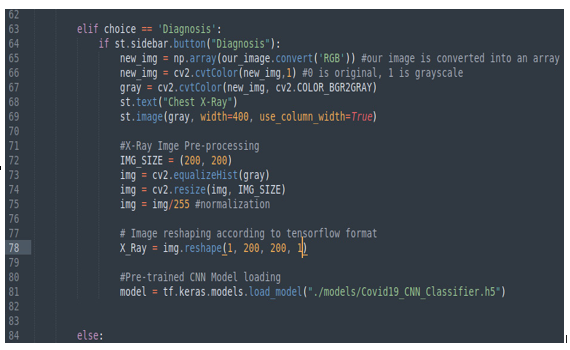
Figure 10.6: Image reshaping and model loading
Our model variable has a method named predict that returns the probability of the prediction in a list containing two elements: the probability of no Covid and the probability of Covid. Since we are performing a binary classification (true or false, so no Covid or Covid) we want to know whether or not the picture represents a case of Covid; we can do this using the argmax method of np (numpy). argmax checks the values of a list and provides the index of the maximum value, which in our case is 0 or 1 (0 in the case of no Covid and 1 in the case of Covid). So, if the prediction result is a list such as [0.70, 0.30], argmax will return 0; the first index starts from 0 (because 0.70 is greater than 0.30), which means that the diagnosis is no Covid since the probability of no Covid is 70%, while the probability of Covid is 30%.
To complete the Diagnosis voice of the menu, we can add the following code:
diagnosis_proba = model.predict(X_Ray)
diagnosis = np.argmax(diagnosis_proba, axis=1)
Here is the code we implemented:
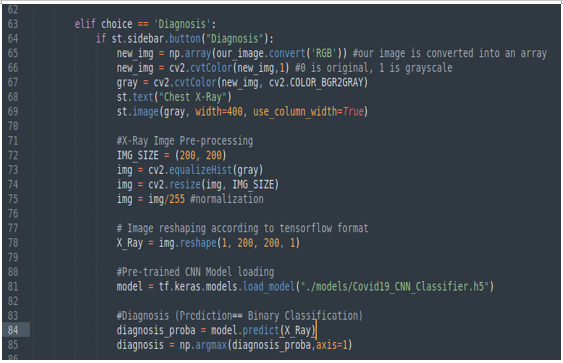
Figure 10.7: How we get the prediction
At this point, we have everything we need to display the result on the screen.
Now, as the first frontend element, we must create a progress bar in the sidebar that indicates the status of the diagnosis prediction. For this, we can write the following:
my_bar = st.sidebar.progress(0)
A progress bar always works with a timer, so we should import time at the very beginning of our Python file. This is the reason we did this when we started this project (see Figure 8.4 in Chapter 8). Let’s continue by adding the following code:
for percent_complete in range(100):
time.sleep(0.05)
my_bar.progress(percent_complete + 1)